Install SwyxWare HealthMonitor Grafana Dashboard (as example)
In the "Monitoring/grafana" directory you will find two ready-made dashboard templates which you can use as a starting point for configuring your own Grafana dashboards. To install them, proceed as follows:
1 Open the Grafana website in a web browser and log in.
2 Select "Manage Dashboards" from the navigation bar on the left.
3 Select "Import | Import json file".
4 Import the file "SwyxWare HealthMonitor Overview.json".

Grafana displays a page with options.
5 Under "Select a prometheus data source" select "Prometheus" and click on "Import".
6 Repeat steps 3-5 for the file "SwyxWare HealthMonitor Alerts.json".
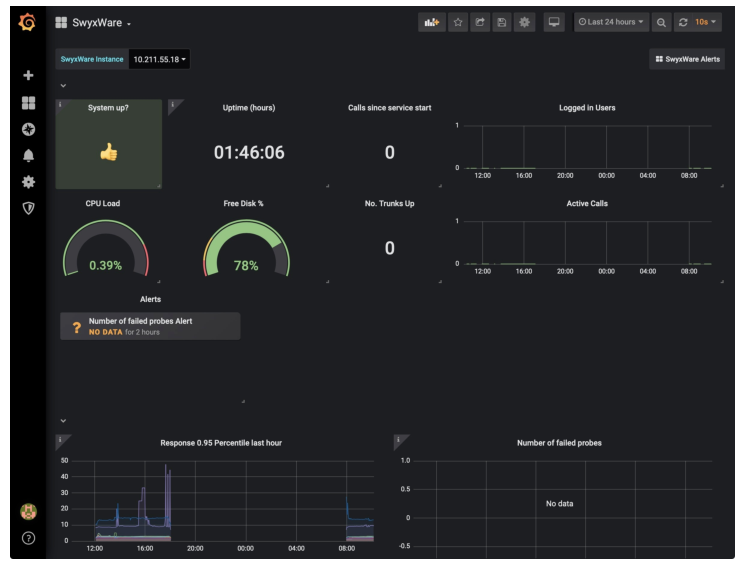
This is a sample dashboard for a Grafana alarm that is triggered when HealthMonitor stops reaching a service.
Last modified date: 01/24/2024